 Felicity Brambling-Wells
 10087
10087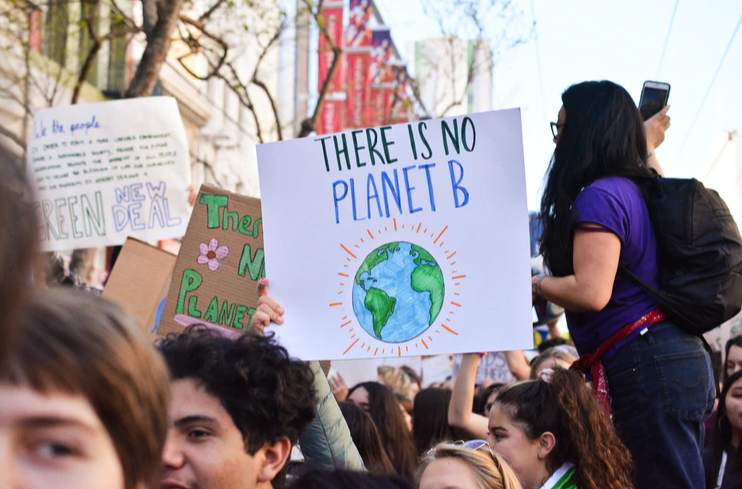
The Environmental Performance Index, or EPI, is a ranking of 180 countries in terms of environmental health and ecosystem vitality, essentially a performance review on their sustainable development.
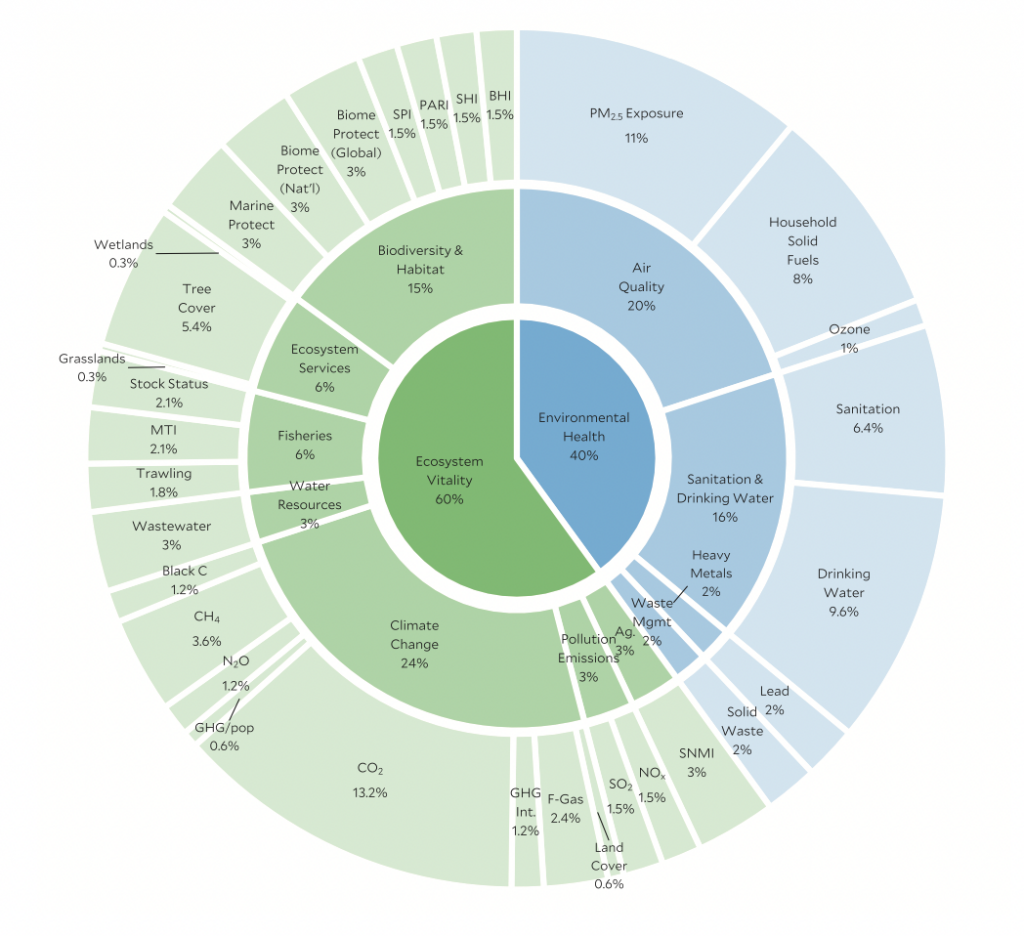
The ranking is determined by using 32 performance indicators across 11 main issues, such as air quality, biodiversity and levels of climate change. The UK ranks 4th our of the 180 countries, with the global west consistently falling into the higher ranks on their scoreboard. So what does this mean, in brief?
According to the report “Two distinct clusters emerge at either ends of the distribution: the Global West scoring the highest in both dimensions, and Sub- Saharan Africa generally faring poorly.”, indicating that sustainability is significantly more achievable for countries that are typically considered wealthier or more developed.
The report indicates that environmental health is much stronger in more developed countries, but this advantage is less obvious in terms of ecosystem vitality, where results are much closer. The EPI report suggests “positive environmental performance requires not only economic prosperity but also good governance, including a strong rule of law, vibrant public engagement, an independent media, and well-crafted regulations.” In order to increase our score, as well as increase the scores of the globe as a whole, we must focus on strong governmental action to ensure sustainable actions, like forest preservation, CO2 reduction, and a shift to more sustainable energy.
The EPI is an incredible source that combines a great deal of information around sustainability, creating a picture that clearly defines where countries are succeeding and falling behind in terms of sustainability. It’s not without its shortcomings, which is to be expected when sustainability is boiled down to such easily measurable points, but the generalised information is a good indicator into global trends around sustainable development.
The full report for 2020 can be accessed and is well worth your time if you’d like to learn more about this. The pie chart, cover image and information quoted in this article have all been sourced under the Creative Commons Attribution-NonCommercial-ShareAlike 4.0 International License from Yale University.
by Dan Johnson, SGO Projects Officer #actingtogether


