 Bethany Climpson
 1576
1576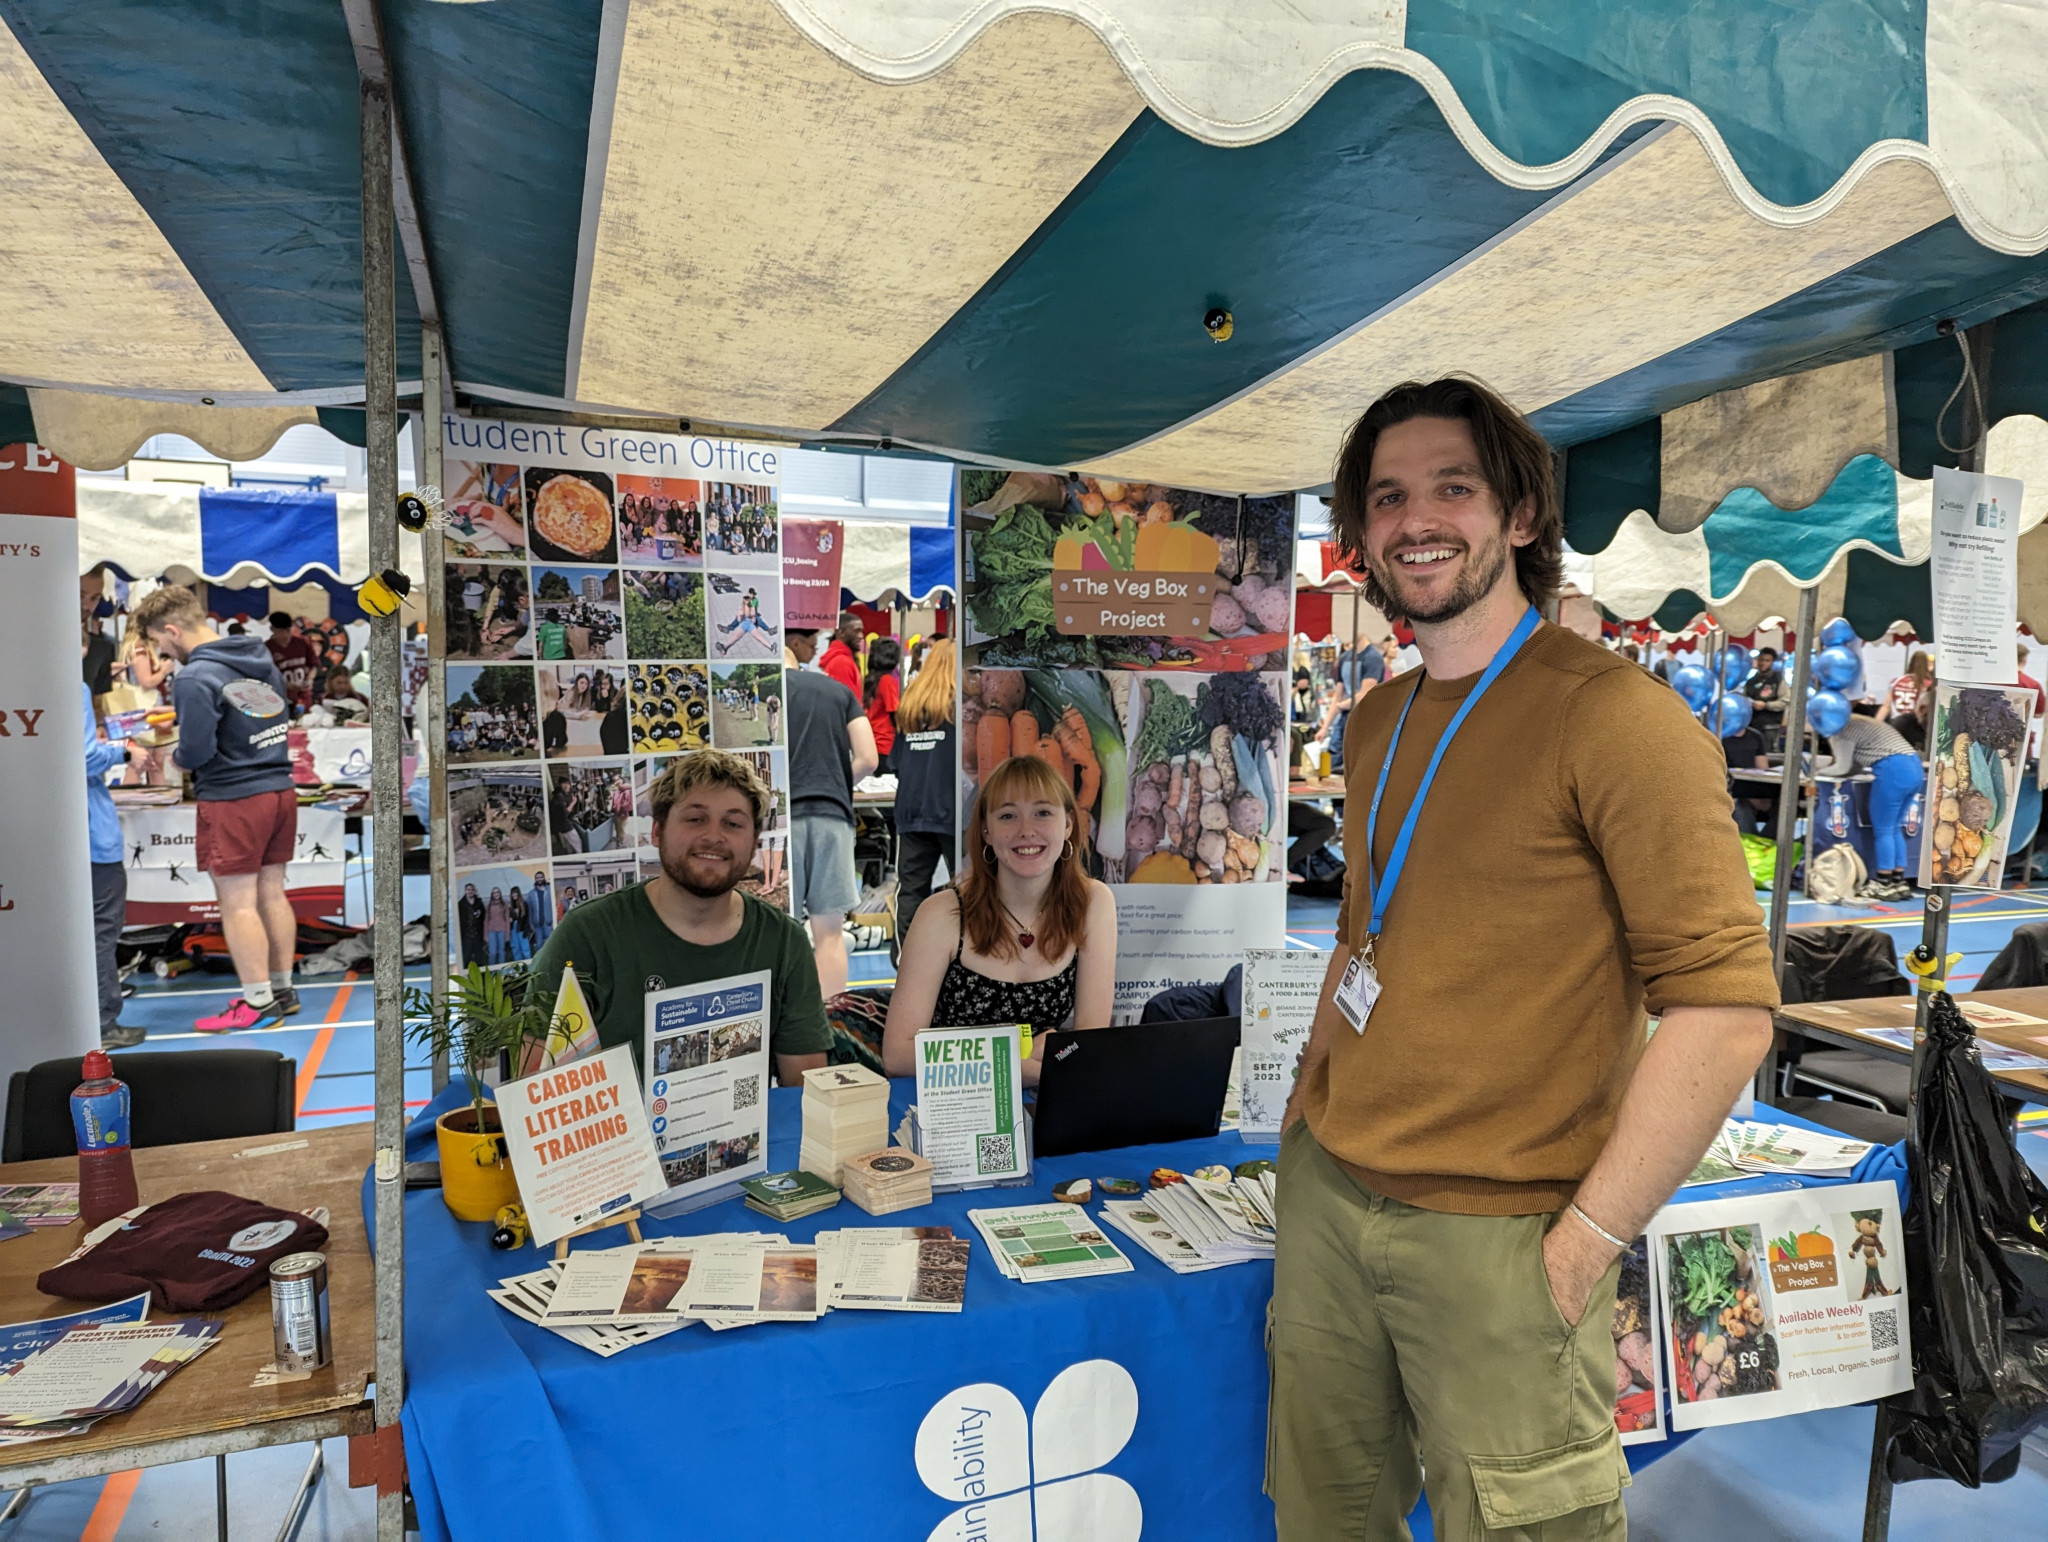
Hi! I’m Jack, and I’m excited to be part of this year’s Student Green Office team. I’m studying for a PGCE in Further Education.
Funnily enough, my decisions to study at CCCU and join the SGO were both inspired by the same thing: a map.
But not just any map – it was a map that convinced me that I needed to take action on climate change.
Now, I’ve been working in politics and activism for a long time. I joined a political party when I was just sixteen. I campaigned against cuts to my youth service in Essex (unsuccessfully), I campaigned against Brexit (unsuccessfully), and I campaigned for my undergrad university to become a Real Living Wage employer (successfully!). I worked for a trade union during the pandemic and, later, a community-organising charity, supporting local leaders in south London.
All that time I knew that the climate crisis was happening, but it was never an issue that gripped me. There were too many fights going on, and it seemed so big and far off that I wanted to get my head down with here-and-now stuff. (At uni I even had a bit of a personal grudge against the Extinction Rebellion team because they did a roadblock during our Living Wage action.)
But that was challenged last summer. Do you remember the choking, dry heat when that weather front sat across the UK in 2022? I certainly do: sweltering in 40 degree heat, trudging from church hall to church hall to support local campaigners, air con nowhere to be found. It was tough. But at least it passed.
Then I saw the map.
I was scrolling through Facebook (yes, I still use Facebook) one evening seeing various inevitable comments from the older generation – climate change isn’t real, it’s overblown, we had a 40 degree heatwave in 1976, so what’s so different now?
Well, it’s true. The UK did experience temperatures of over 40 degrees in 1976. But then I continued scrolling, and found the map, and it put it all in context.
See, here’s a global temperature map from the June 1976 heatwave:
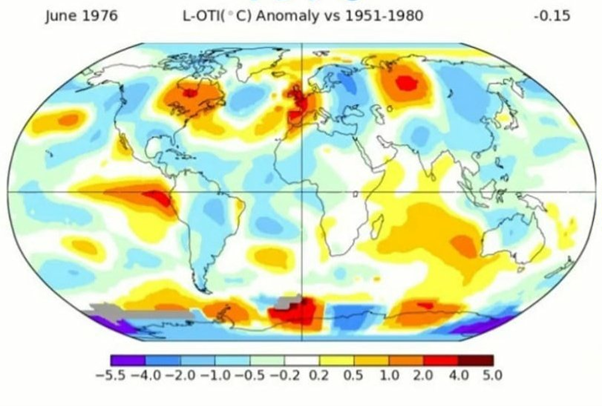
Compared to the 30-year average, there are a few bits that are unseasonably hot – the UK is an obvious one. But most of the rest of the planet is blue or white, with only small deviations from average temperatures.
Okay, ready?
Now: here’s the June 2022 map:
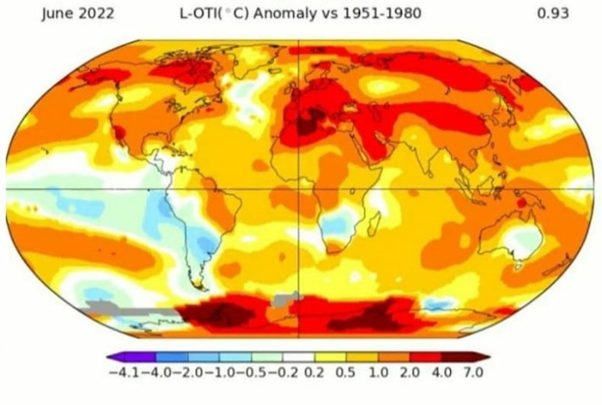
Okay. Yeah. Everything is hotter than it should be. Except for Uruguay and Namibia. But those two aside – well, the message was pretty clear. Our planet is cooking.
I saw that photo and thought: oh. I should probably get involved in doing something about this.
I’d heard enough (thanks to XR’s awareness-raising work) to know that we’re at a critical window: we have until about 2030 to lock in the policies we need to prevent catastrophic climate change. I started to wonder what things would look like in ten years if we – I – didn’t take action now.
It would mean that brutal 40-degree summers would be normal. It meant that all the work my community leaders were doing on housing and youth safety would have to be replaced by campaigning for access to water rations. And countless more changes I couldn’t begin to imagine.
So I decided to take action. I began by reading, and thinking about where I could put the skills I’d learned to good use. To my surprise, I found a lot of cause for cautious optimism: there are many good ideas to save the planet – they just need more oomph. More people pushing for change in the right places.
I came to the conclusion that I have to keep learning everything I can about sustainability; and I also have to share everything I’ve learned along the way about making change. That would be the best impact I could make at this point. So I applied for a teacher training course – and to join the SGO.
All that because of a map!
As SGO officer my personal goals are to support Carbon Literacy Training and to help implement the CCCU’s Vision 2030 goals by embedding sustainability in course curriculums. But I get most excited about meeting and working with students like you. If there’s a change you’d like to make – about recycling bins, or paper use on your course, or anything sustainability-related – drop me a line on js1623@canterbury.ac.uk and let’s arrange a chat.
At the cost of coining a cringy phrase: let’s (s)go!
Map source – https://data.giss.nasa.gov/gistemp/maps/
By Jack Swan, SGO Project Officer


Great blog post, Jack! Good luck for your work with the SGO.