 Emma Latham
 6752
6752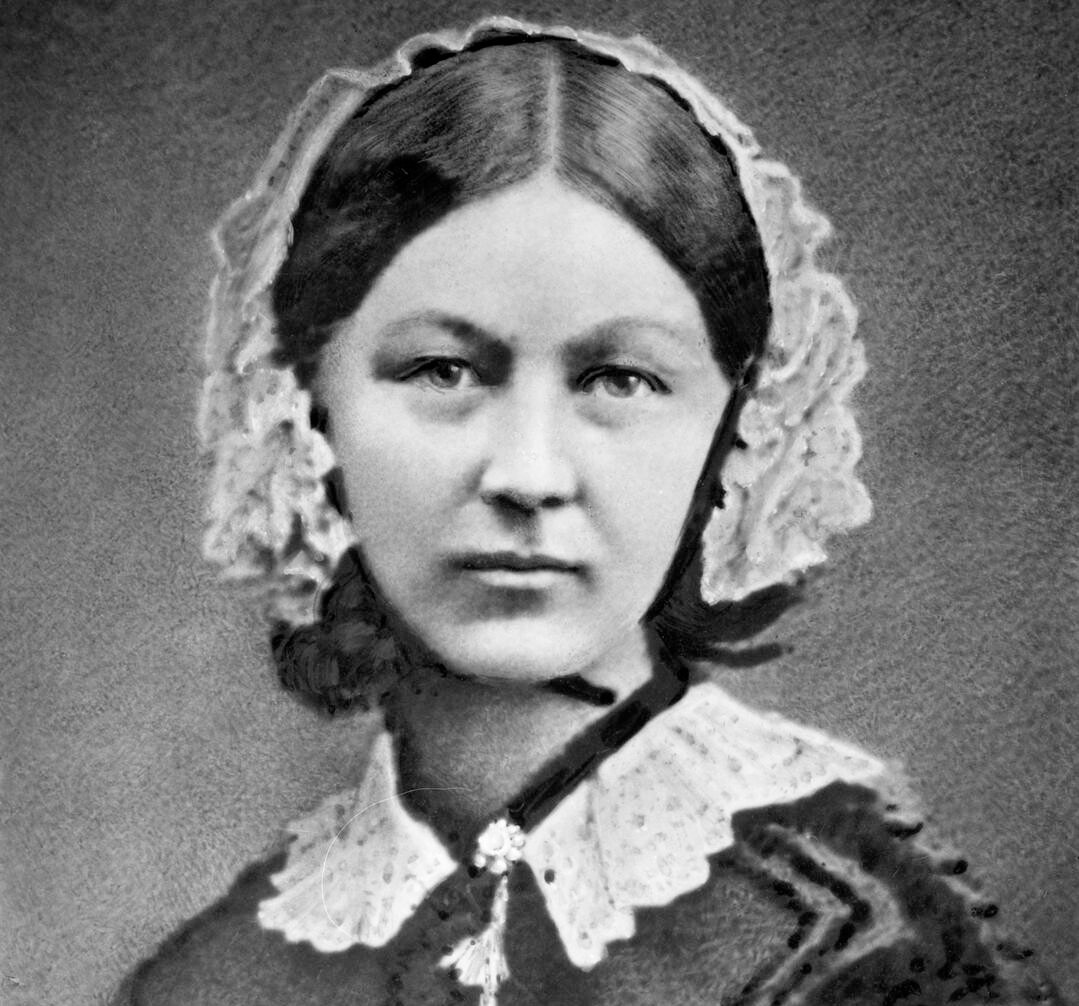
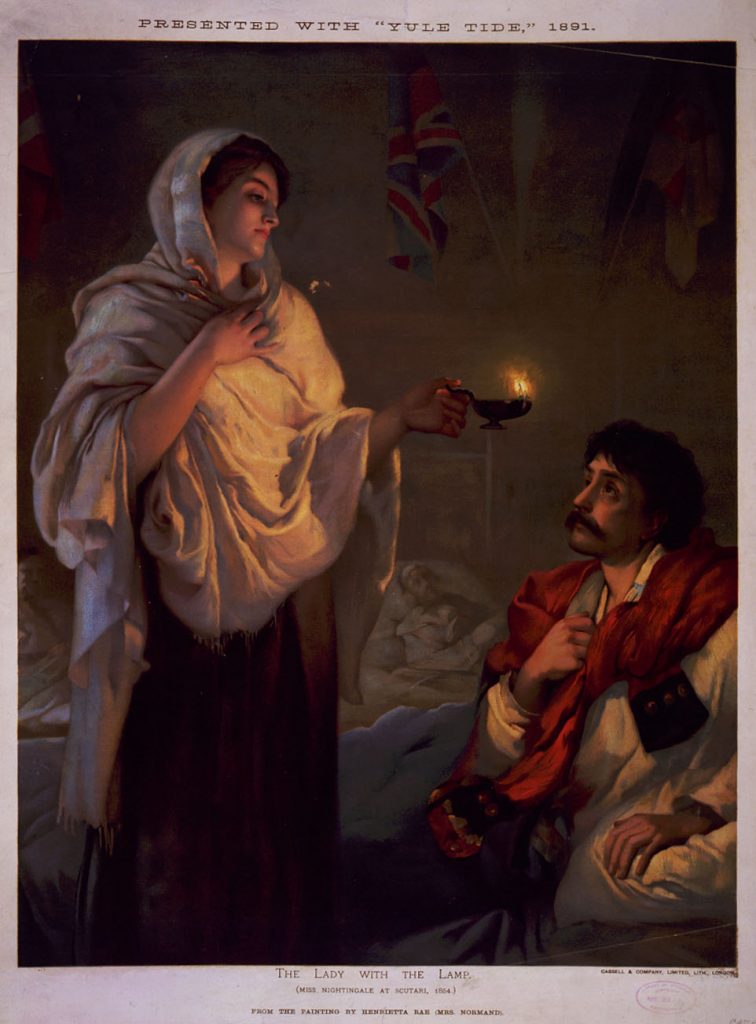
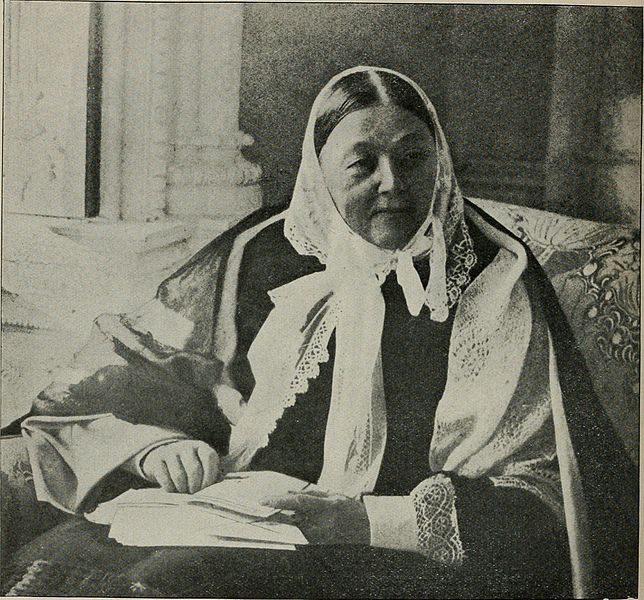
Next month, 12th May to be precise, sees the 200th birthday of Florence Nightingale. With the construction of the NHS’s COVID-19 critical care field hospitals, known as Nightingale hospitals in England, the legacy of ‘the lady with the lamp’ is as relevant and prevalent as ever. In addition to this bicentenary, 2020 is the World Health Organisation’s ‘Year of the Nurse and Midwife’ so a look at Nightingale’s life and work feels especially relevant. While she is regarded by many as the founder of modern nursing, what is perhaps less well known is her prowess as a mathematician and statistician. Indeed, she was a pioneer in the visual presentation of information, displaying data through means that were at the time truly novel.
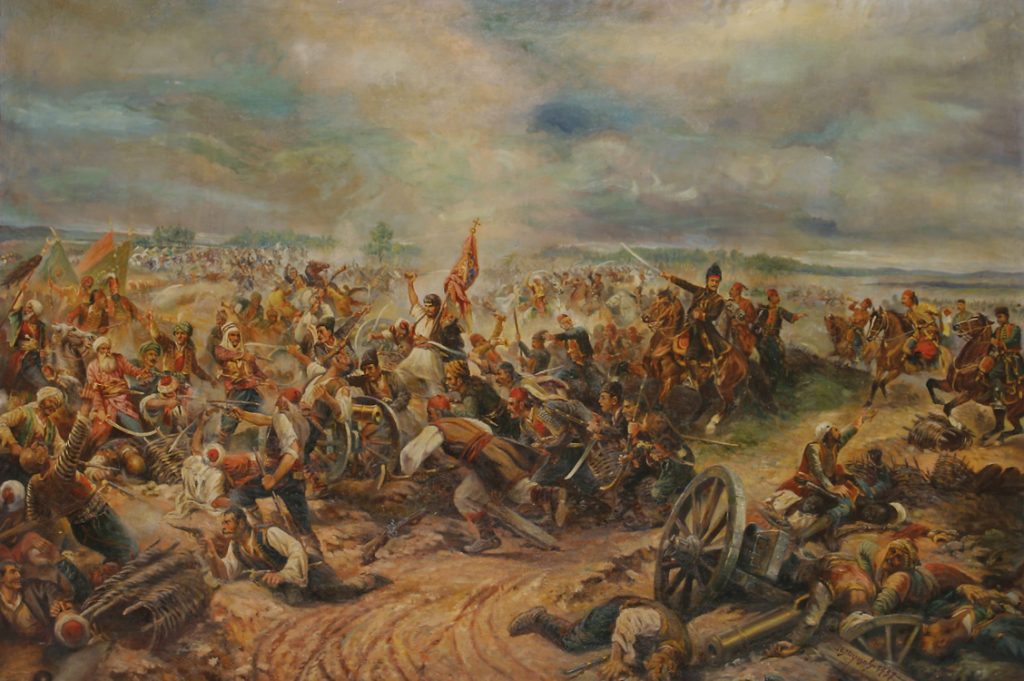
Born to a wealthy and well-connected family, Nightingale defied the wishes of her family and the conventions expected of women of her status to fulfil what she felt was a calling from God for her to become a nurse. It was during the Crimean War that Nightingale rose to fame, gaining a reputation as a comforting presence to the soldiers whose care she administered, and advocating for sanitary conditions to reduce deaths through disease and infection. There has been much discussion and some disagreement between scholars and researchers as to whether Nightingale’s achievements have been overstated, and she has faced criticism regarding her interactions and attitudes towards fellow wartime nurse, Mary Seacole. While one could certainly write reams dedicated to the dissection of Nightingale’s credentials as a revolutionary figure in nursing, I would like to focus this blog on her innovative use of statistics, and I have used the electronic resources available through LibrarySearch to do so.
“To understand God’s thoughts we must study statistics, for these are the measure of his purpose.”
In today’s digital world we are no strangers to the display of data in visual formats; infographics with eye-catching and easy to interpret charts and graphs in bright colours are often the norm. In Nightingale’s time, however, statisticians tended to prefer tables for the organisation of information, no matter how large the data set. Nightingale, a gifted mathematician who had excelled in the subject under her father’s tutelage, was to take a radically different approach. Credited with drastically reducing the mortality rate of the field hospital in which she worked, Nightingale found the number of military lives lost throughout the Crimean War utterly unacceptable and was convinced that the vast majority of deaths were due to poor conditions such as bad drainage, poor ventilation, overcrowding, and contaminated water. Upon her return to Britain after the war, determined for lessons to be learnt, she set about compiling statistical analysis of military losses in the Crimea, working with noted medical statistician William Farr.
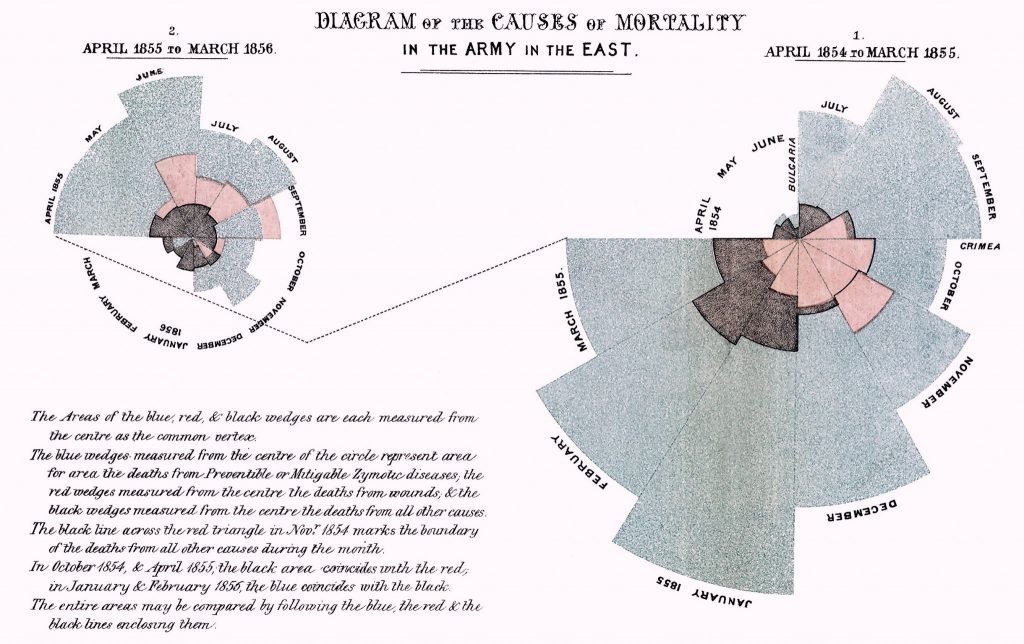
As stated by Nightingale scholar Lynn McDonald in Florence Nightingale, statistics and the Crimean war, ‘The methodology that she acquired post war in analysing what went wrong would ground her decades-long campaigns for social and healthcare reform’. While appealing to the British government and military regarding the importance of sanitation and for resources to improve healthcare conditions, Nightingale employed the use of carefully-designed polar area diagrams, a close relation of the pie chart, in order to convey the mortality rates of soldiers in the Crimea and their causes of death. As Alison Hedley describes in her article Florence Nightingale and Victorian data visualisation, ‘what made Nightingale’s graphs particularly iconic was their powerful use of visual rhetoric to make an argument about data’. Victorian statisticians and mathematicians preferred tables because they presented the data in its entirety, and if they did use graphics they did so to explore data in depth, not to extrapolate findings and use them to support and illustrate a narrative. Nightingale, unlike her contemporaries, used visual information to tell a story and, crucially, she made it accessible and understandable to non-specialists.
Florence Nightingale understood the power of statistics as a tool to inform, educate and enlighten, was incredibly passionate about their proper use, as this quote, featured in an article by Samuel Luke Tunstall about featuring Nightingale in statistics education, illustrates:
“The Cabinet Ministers, the army of their subordinates…have for the most part received a university education, but no education in statistical method. We legislate without knowing what we’re doing. The War Office has some of the finest statistics in the world. What comes of them? Little or nothing. Why? Because the heads do not know how to make anything of them.”
“Were there none who were discontented with what they have, the world would never reach anything better.”
In 1859, Nightingale and writer Harriet Martineau published the book England and Her Soldiers, which married a literary account of the Crimean War and the British military’s failings with regards to healthcare provision with Nightingale’s statistical studies and used her graphics to illustrate and highlight their findings. That this book was available to and written for the general public demonstrates Nightingale’s commitment as an advocate for public health and her firm belief in visual formats as key for conveying points that are less easily grasped through tabular presentation. If you would like to read more about the collaboration between Nightingale and Martineau, Iris Veysey’s A statistical campaign: Florence Nightingale and Harriet Martineau’s England and her Soldiers explores the creation and impact of the book.
“I think one’s feelings waste themselves in words, they ought all to be distilled into actions and into actions which bring results.“
I stated earlier that this blog would focus on Nightingale as a statistician, rather than as a nurse, but of course the two are inextricably linked; Nightingale used her mathematical insights and abilities to inform her medical practice and advocacy. After the Crimean War, she turned her attention to health and welfare conditions both abroad, for example in India, and at home. As Lynn McDonald states in Florence Nightingale: Passionate Statistician, Nightingale could ‘see individuals in quantitative data’. Where some might see only dry figures, Nightingale discerned people whose lives could be improved through reform. Nightingale’s contribution to the field of statistics led to her being elected the first female member of the Royal Society of Statistics in 1859, and in 1874 she was made an honorary member of the American Statistical Society. Her findings and recommendations have been incredibly influential and their impacts long-lasting, and so while she is most often remembered as ‘the lady with the lamp’, she should also be remembered as the mathematician with the graphs, charts, and commitment to sanitation and public health.
The library buildings may be closed currently but there’s so much online to explore. If you would like to take a look at any of the articles mentioned in this blog, or read and learn more about Florence Nightingale’s life, work, and legacy, take a look at some of the many electronic resources available through LibrarySearch.


